Accelerating Operational Sustainability
Analyzing
Time-Series Data:
Industrial IIoT
All images provided by TrendMiner unless otherwise noted
By Wouter Daniels,
TrendMiner
Industries that optimize their digitalization journey by adding an analytics tool can help reduce energy costs on heat recovery steam generators such as the one shown above.
The intersection formed via the Industrial Internet of Things, digitalization and technology such as advanced analytics allows manufacturers to leverage time-series and contextual data for process insights.
Process industries face many operational challenges; however, analyzing time-series data can help improve operational performance and increase sustainability efforts. In addition to having unique process issues, each industry also must contend with common challenges:
- Energy consumption and the associated high costs.
- Water, which is becoming scarce, and post-production wastewater treatment.
- Emissions reduction and environmental impacts.
Traditional approaches to addressing these issues were time-consuming before industries began to embrace the Industrial Internet of Things (IIoT). While the chemical industry was quick to adopt digitalization, other industries have been slower in following its lead. By implementing innovative technologies, industries can create new ways of operating to optimize processes and reduce costs while remaining profitable.
Per the World Economic Forum Digital Transformation Initiative[1]:
For companies that embrace digitalization, it offers the promise of a more nimble and profitable business, with improved decision-making and increased employee empowerment. More importantly, when designed and implemented correctly, digitalization can improve health, safety and environmental impact — saving lives, reducing injuries, lowering emissions and waste, and increasing transparency and sustainability.
Companies in many industries can address their challenges and achieve their bottom-line goals by embracing digitalization. Moreover, they can do more with their process data with the use of advanced analytics software.

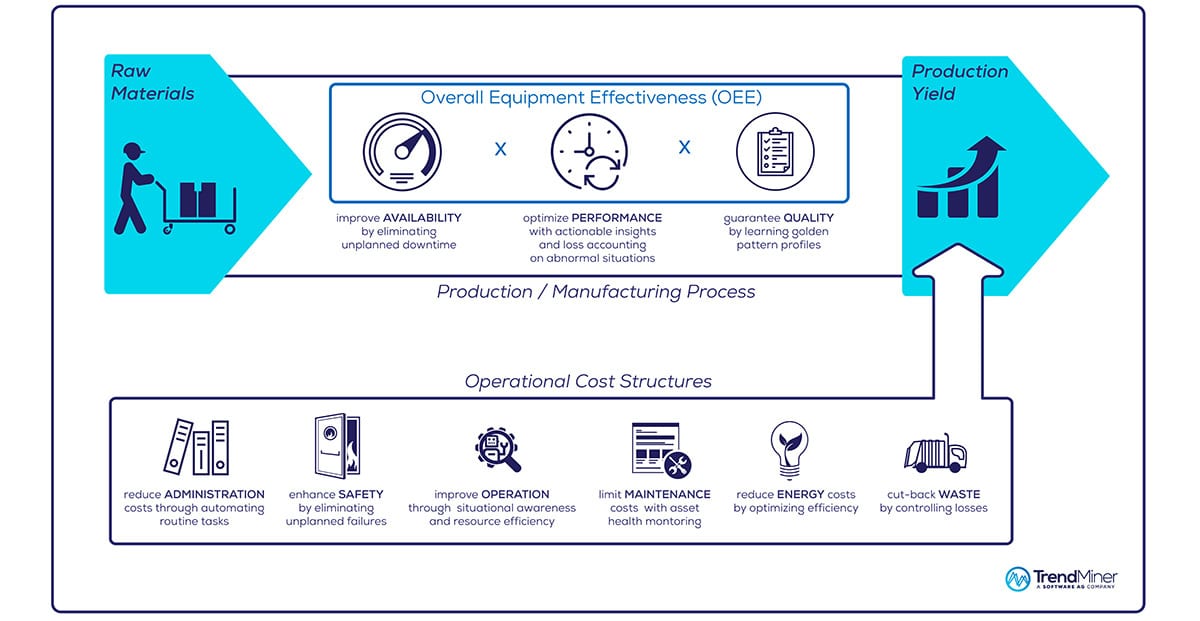
A data analytics tool improves overall equipment effectiveness (OEE), which in turn increases yield from raw materials.
Improving Operations via Process Time-Series and Contextual Data
Most industrial processes capture extensive time-series data. The raw data is a valuable resource that tells a story. By using technology such as advanced analytics, industry-specific process experts are empowered to solve problems themselves. This benefit can lead to significant value.
Using tools and self-service analytics can help process experts reduce downtime by finding the root causes of a process anomaly quickly. It also can alert personnel about process deviations and extraction efficiency. The processing of raw materials can be maximized. Process experts also can gain insight into the performance and reliability of assets to schedule timely maintenance, thus prolonging asset health and life. This will result in much-needed overall equipment effectiveness.
With advanced analytics, process experts will have essential engineering support and a round-the-clock approach to running and managing their industries. The result is improved overall equipment effectiveness (OEE). Advanced analytics solutions also can interpret time-series and contextual data. Data such as raw material information, operational events, maintenance schedules and environmental conditions often reside in third-party business applications. These create data silos. When these various data sources are integrated and made readily available, engineers can gain a deeper insight into their operations. This approach is more efficient than tracking numerous separate files in different teams and departments.
Solving Industry-Specific Challenges
The advantages of using advanced analytics software span across multiple industries. For example:
- The chemical industry can compare undesirable batches with ideal batch characteristics and learn the root causes of the batch deviations.
- The food and beverage industry can use it to improve product quality and decrease costs.

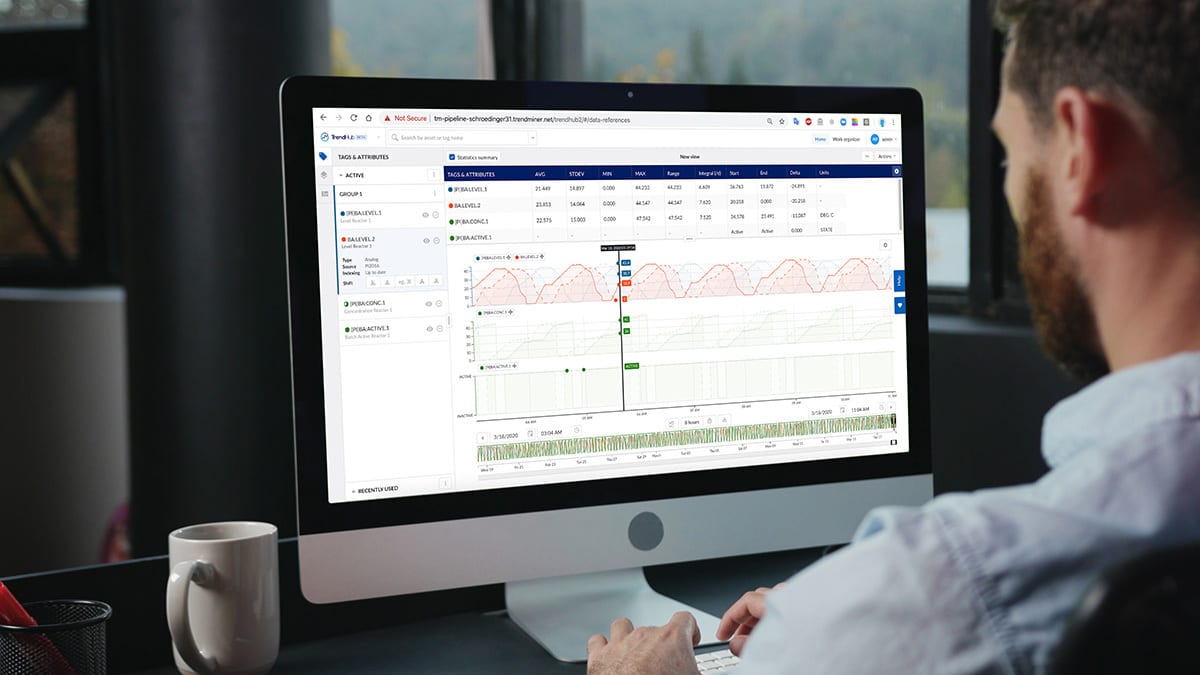
An engineer uses time-series data to learn how to reduce time cycles in batch productions.
Use Case: Yield Increase Through Cycle-Time Reduction. A plant in the chemical industry produces specialized fibers. In addition to their use in coatings and films, the resulting fibers are used in the pharmaceutical space and are subject to strict quality constraints.
To produce fibers with the required and desired characteristics, the raw materials pass through a batch reactor. Each batch reaction has multiple stages, with each transition from one stage to the next being controlled thoroughly. The final performance of the process is measured through metrics such as cycle time, end-product quality and yield.
Over time, the production of the fibers was suboptimal. Batches were taking longer to complete, which led to increased cycle times. Before using self-service analytics, the team attempted to identify the root causes of the cycle time delays but was unable to use conventional tooling.
Comparing operations over time helped identify changes in the workflow. Software was used to identify the five best batches that were produced historically in the five years of data available in the historian as a comparison point for more recent production batches.
To find the best batches in the data available, a good definition of what constitutes the golden standard was required. A pre-processing step was done to remove all batches that did not meet the quality criteria:
- All batches of irrelevant product types were removed.
- All batches that did not run to completion were removed.
- All batches where the end quality did not meet the desired specification were removed.
This pre-processing was accomplished using the software via the search and filter functionalities within the self-service analytics software.
Once the pre-processing steps were completed, the dataset was reduced to batches that met the minimum requirements. The next step was to limit results — by searching and sorting the results based on duration — to those batches that had the highest yield/shortest cycle time. The 15 shortest batches were layered on top of each other, revealing the ideal batch profile in the process.
The final step consisted of overlaying 10 recent batches on top of the golden batch profile. Immediately, a clustering became apparent. Midway through the full batch cycle, the recent batches significantly deviated from the historical best performers. Furthermore, subject matter experts could immediately recognize that this was related to a change in the ramping up of a raw material feed. The material was being added at a slower rate compared to historical golden batches.
Process engineers were able to retune the feed controller and map the feed ramp rate to match historical performance. They had been faced with increased cycle times for quite a while, which lead to tangible production and revenue losses. The improvement potential is around 30 minutes on a nine-hour batch cycle, which corresponds to an estimated $1 million per year in business value.

This process expert is using a self-service data analytics tool to find the root cause of clogged airflow in a production process.
Use Case: Increased Energy Production by Resolving Clogged Airflow. A plant in the energy and utility industry uses natural gas to produce electricity. This combined-cycle gas power plant is equipped with two turbines that power a generator.
The primary turbine is powered by hot air, which is generated by burning the gas. The secondary turbine is powered by steam that is generated by heating water with the air coming from the primary turbine.
Over time, the performance of a unit of the plant’s power station began to worsen, which lead to capacity and revenue loss. The loss was gradual, so it went unnoticed at first. After a couple of years, however, it became clear that performance was degrading. The team wanted to quantify the impact and duration of their losses. Before using analytics software, process experts did not have the toolset to do this efficiently.
A decrease in performance usually is a gradual phenomenon. With the analytics software, the team could visualize operations. Using a value-based search, the decline in performance was confirmed quickly and quantified. This formed the foundation for the rest of the analysis.
Because of external factors such as unplanned downtime and load reduction on market demand, the team needed to dig deeper to measure the actual performance of the unit. To do this, the engineers used analytics software to identify which process parameters differed consistently between those two time periods to find a potential root cause of the decreased performance.
The performance of the power station depends on the ambient temperature, so the team started by finding periods where the ambient temperature was relatively constant. A value-based search was performed to find periods where the ambient temperature is between 80 and 83°F (26 and 28°C). They also filtered out periods where the plant was not running or the power was too low. Once this was completed, the average power production could then be calculated and exported for assessment. The results showed that the performance of the current power station indeed decreased about 2 percent over three years.
Using the analytics software’s layering functionality, good performance periods were selected from 2014, while bad performance periods were selected from 2015 and 2016. The engineers could identify potential root causes of the problem using the layering comparison table.
The team found that the gas fuel flow, the compressor discharge temperature and the inlet guide vanes reference angle differ consistently for both groups of layers. The resulting observations led to the hypothesis that the root cause of the problem could be explained because of non-calibrated inlet guide vanes, which impeded air and fuel supply and, ultimately, power generation in the gas turbine.
Using the annotations in the software, observations were captured and shared within the organization for the investigated periods. When an engineer goes back and looks at the production data, he or she will be made aware of the non-calibrated inlet guide vanes. The engineer will know immediately that this data corresponds to suboptimal operation and know why. Capturing valuable information ensures the availability and distribution of knowledge and will provide opportunities for organizations to enhance productivity and gain competitiveness.
After years of reduced power production and tangible revenue losses, plant engineers needed to identify and resolve the issues at hand. Before using the software, countless time was invested in meetings, discussions and analysis using conventional tools and methods. Still, the engineers were unable to find answers. The analytics software enabled them to identify and resolve the capacity loss efficiently. The improvement potential is around 2 MW of extra production, which results in an estimated $260,000 per year in business value.
In conclusion, industries are struggling with a variety of issues, including functioning during a global pandemic and adhering to increasing environmental regulations. However, with IIoT, digitalization and technology such as advanced analytics, manufacturers can leverage their time-series and contextual data. Industries can illuminate the road forward to reach their bottom line with IIoT and advanced analytics.
Reference
- World Economic Forum Digital Transformation Initiative in collaboration with Accenture: Mining and Metals Industry Executive Summary, January 2017. Retrieved June 15, 2022. https://reports.weforum.org/digital-transformation/wp-content/blogs.dir/94/mp/files/pages/files/dti-mining-and-metals-industry-slideshare.pdf
Wouter Daniels, Ph.D., is a data analytics engineer with TrendMiner. The Houston-based company can be reached at 832-998-2098 or visit trendminer.com.


